Querying change data capture events with cloud data warehouses
Learn how to build consistent snapshots of CDC events that were captured from transactional database systems.
Learn how to build consistent snapshots of CDC events that were captured from transactional database systems.
Data is essential to every organization interested in making business decisions on real-time data. There is, however, a challenge at stake when managing change data capture (CDC) events. With CDC, every INSERT, UPDATE, or DELETE is captured from the data source. For this, we need to ensure that we have a consistent snapshot of the data source. In this article, we discuss how to manage and query CDC events by building an exemplary pipeline that streams CDC events from a PostgreSQL database to the cloud data warehouse, Google Cloud BigQuery.
In data engineering, CDC means change data capture. Every insert, update, or delete in a data source is recorded, captured, and then transferred to a downstream data sink, like a cloud data warehouse (DWH).
Technically, cloud data warehouses, like Google Cloud BigQuery or Clickhouse, seem to favor CDC events because of the following:
These features make it possible to get a consistent view of the data source. The following defines a number of ways to implement CDC systems.
Below are some of benefits to expect or look forward to when you decide to implement CDC based systems
In the first step, we use DataCater to build a data pipeline that streams CDC events from a PostgreSQL database to BigQuery. In the second step, we show how to query and build a consistent snapshot of the CDC events stored in BigQuery.
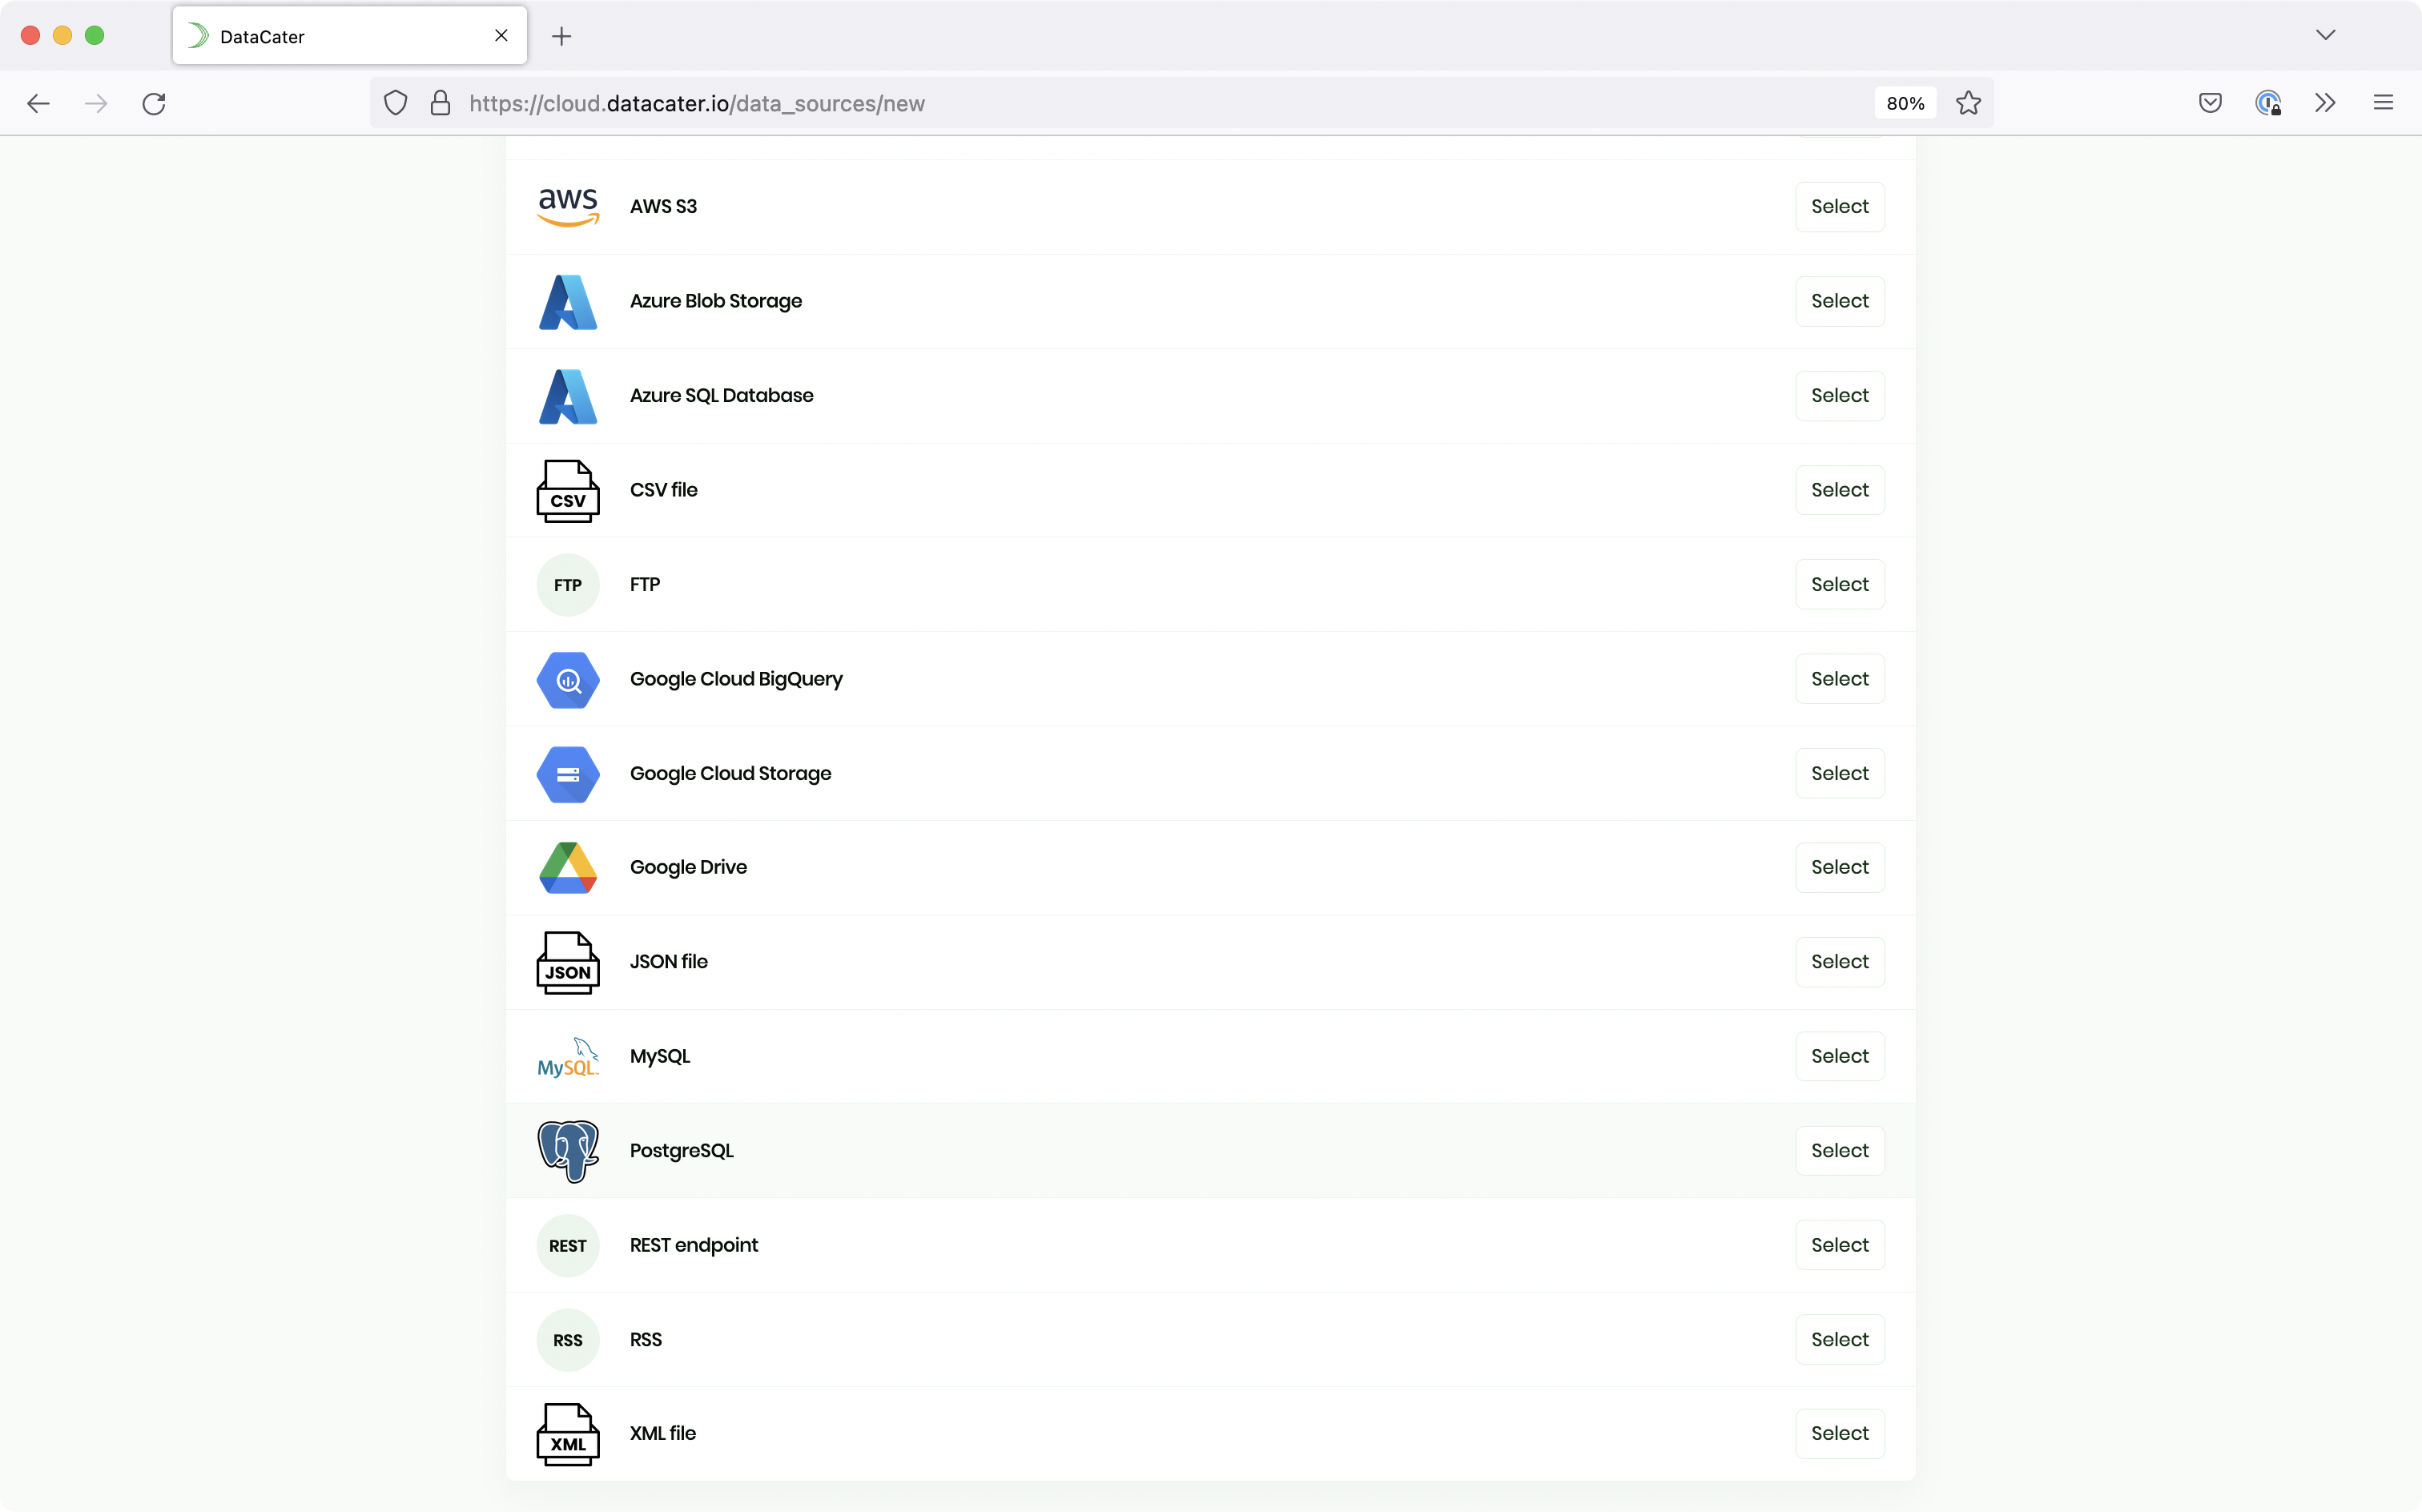
DataCater offers a number of data systems to set up a data source. For this project, we decided to use PostgreSQL since it is a very popular open-source choice for managing business data. This demo should work with any managed PostgreSQL service. The only requirements are that it offers PostgreSQL version 10 or newer and that it allows accessing the logical replication (provided by the pgoutput plugin). Once you have created a free trial with DataCater and signed into your account, click on the Data Sources link at the top of your home dashboard. Then click on the Create Data Source button and select PostgreSQL:

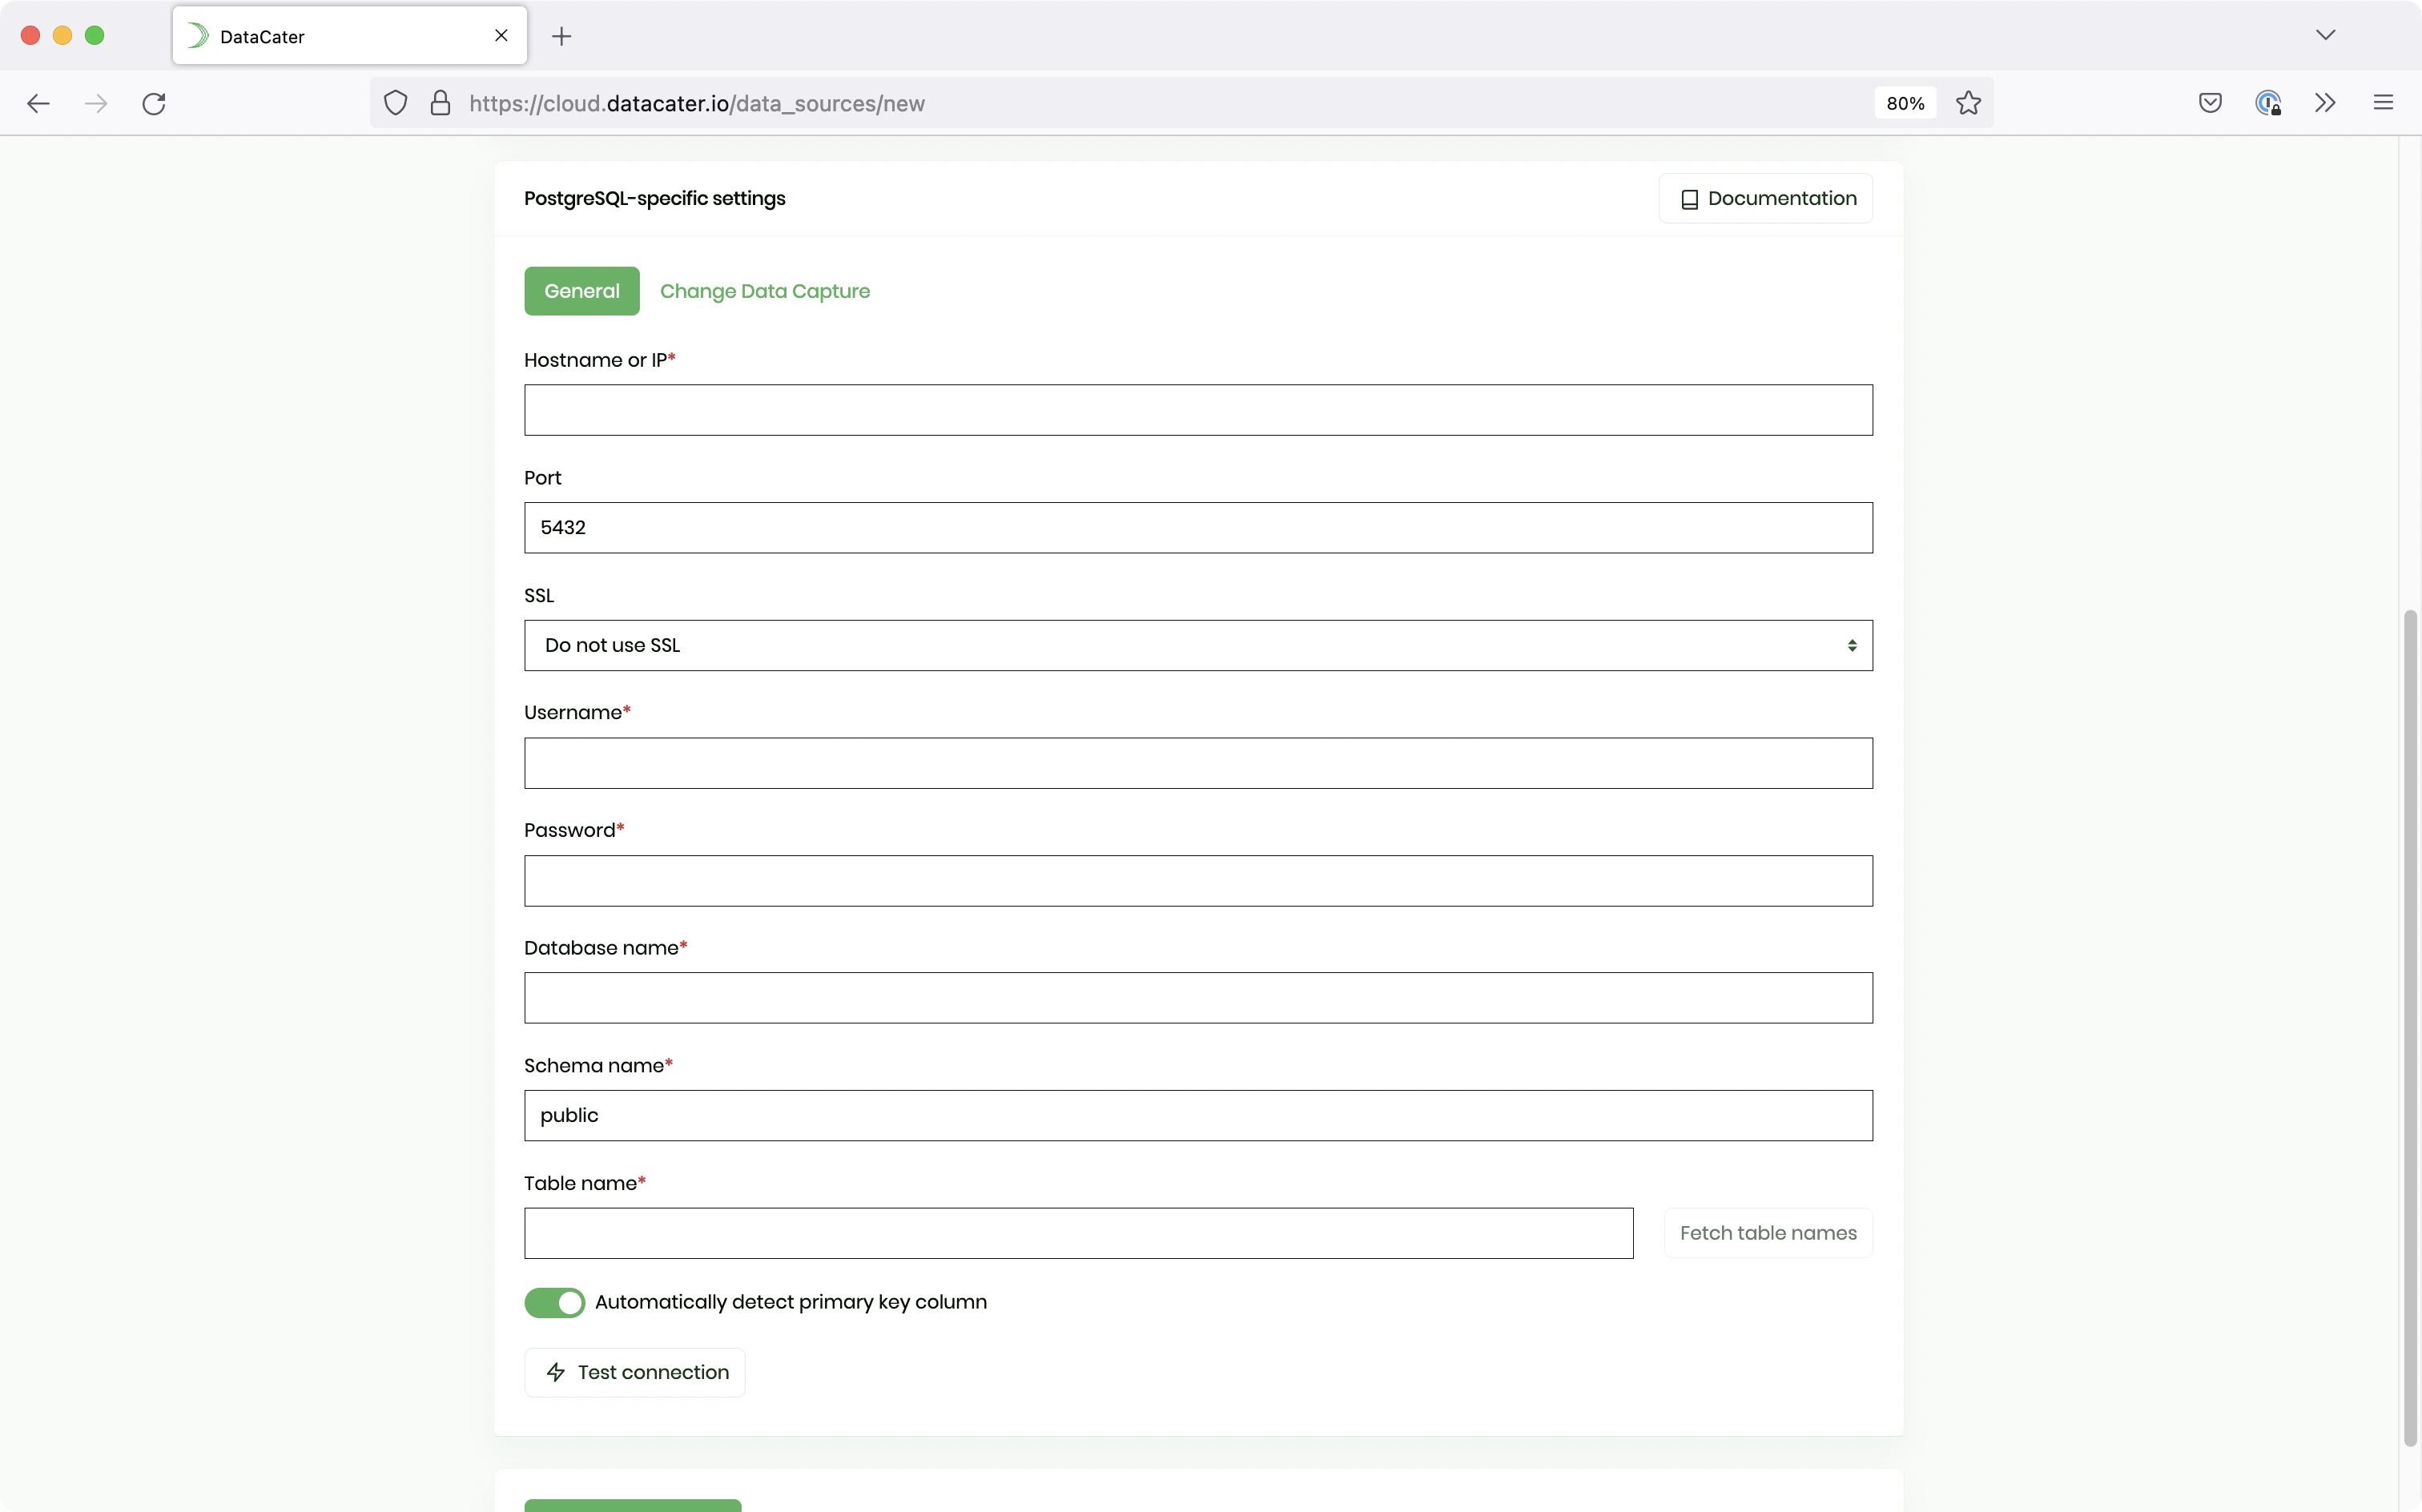
Next, assign preferred values to the following parameters below:

REPLICATION permission. Check this documentation for detailed information on how to inherit privileges or add users to defined roles.Afterwards, test the connection to the Postgresql database server by clicking on the Test connection button. You can then click on the Create data source button to finish setting up PostgreSQL as the data source.
You need a Google Cloud platform account to set up BigQuery as the data sink. In addition, ensure that you have a BigQuery dataset already available
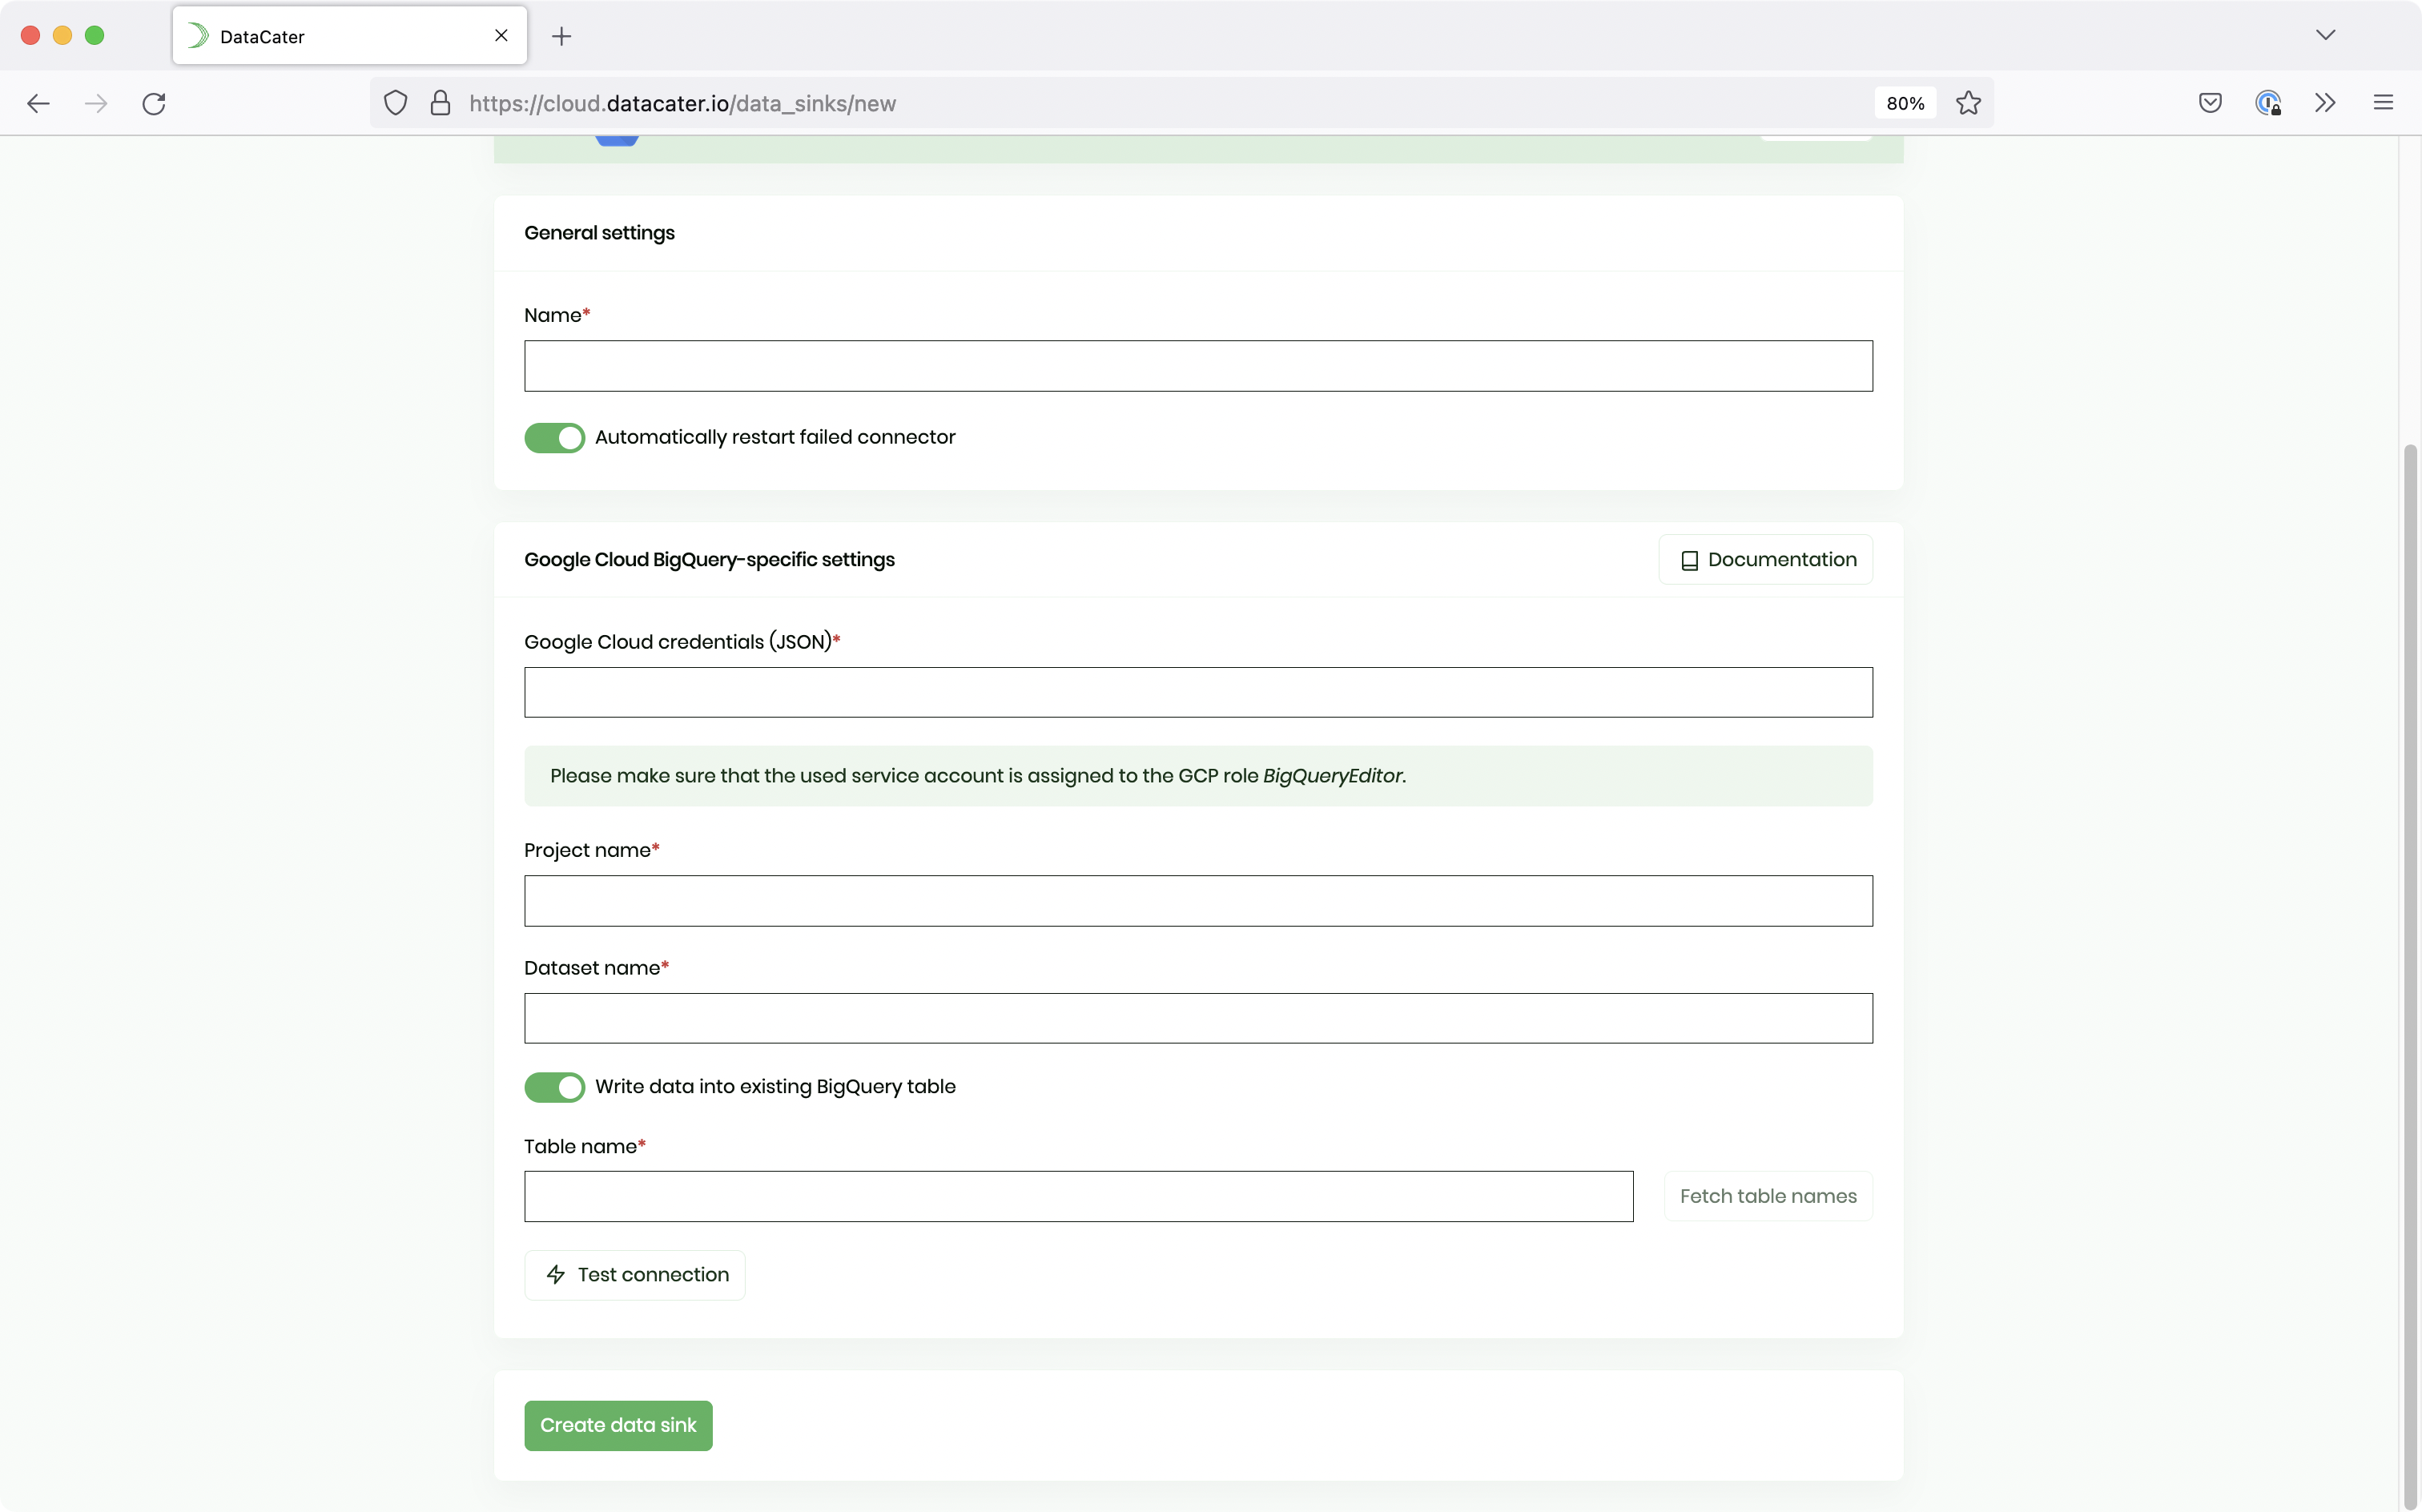
Click on the Data Sinks link at the top and then choose Create Data Sink. Next, select Google Cloud BigQuery.

You need to specify preferred values for the following parameters:
Now it’s time to connect the data source and the data sink together via a pipeline. Navigate to Pipelines and click on the Create pipeline button to create a pipeline for streaming the CDC Events.
Then select your preferred data source as shown via the screenshot below:

Once the pipeline designer is loaded, navigate to Data sink and choose the BigQuery sink we created.
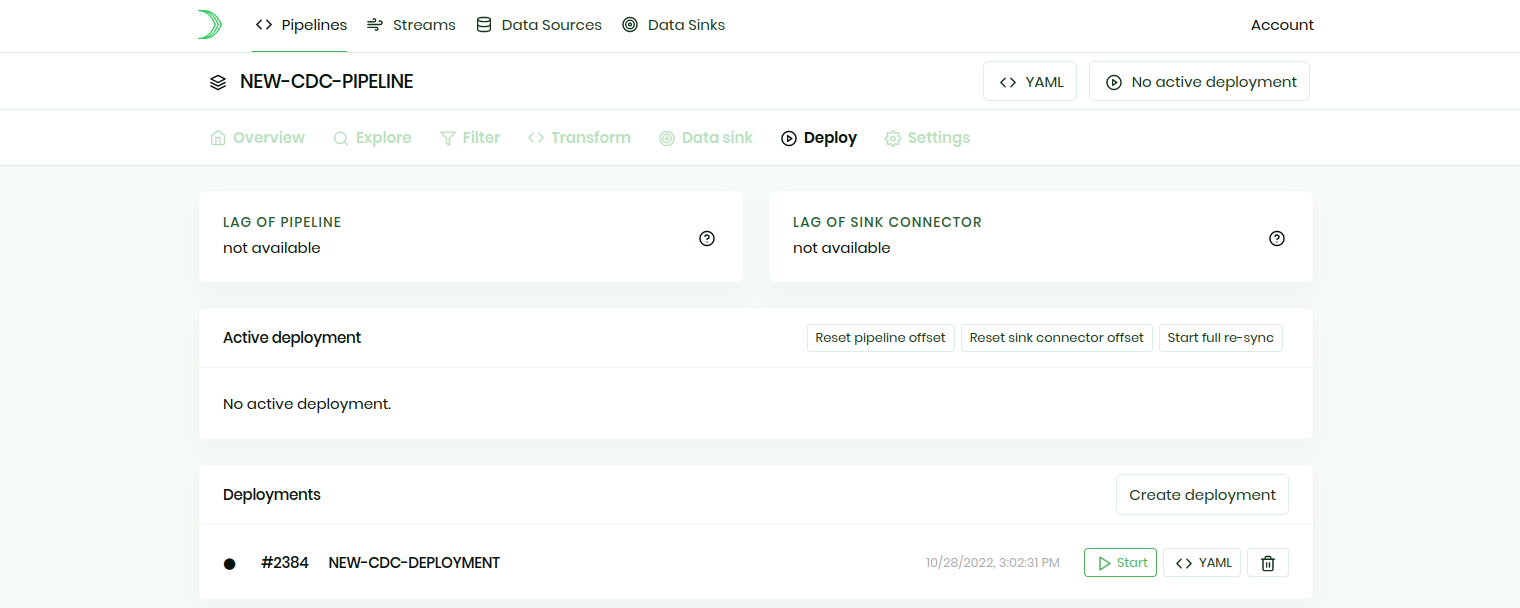
Next, it is time to deploy the pipeline. Navigate to Deploy and click on the Create deployment button. Once the deployment has been built, you can activate the pipeline by starting the deployment.

You can confirm that the CDC pipeline has been deployed by viewing its logs.
There are a number of ways to manage CDC events in a cloud data warehouse, like Google Cloud BigQuery. This section discusses how to manage CDC events in BigQuery using the consistent immediate approach, originally brought up by the folks at WePay, which makes it possible to get a consistent view of the data from the data source.
Let’s assume that our pipeline streamed CDC events to the BigQuery table users in the dataset pg_cdc and that this table features the columns id, resembling the primary key or identifier for each row in the PostgreSQL database table, and updated_at, resembling the time of the most recent change for each row.
We could build the following view on top of the table users which returns the most recent change event for each row:
CREATE VIEW
  pg_cdc.users_snapshot
AS (
  SELECT
    * EXCEPT(row_num)
  FROM
    (
      SELECT
        *,
        ROW_NUMBER() OVER (PARTITION BY id ORDER BY updated_at DESC) row_num
      FROM
        `pg_cdc.users`
    )
);
When working with the data in BigQuery, you could directly query this view. For instance, the following query would return the most recent version of the row with the id 42:
SELECT * FROM pg_cdc.users_snapshot WHERE id = 42;
Of course, you could still access the full changelog. For instance, the following query would return all change events for the same row:
SELECT * FROM pg_cdc.users WHERE id = 42;
Pros:
This approach works perfectly for analytics teams interested in visualizing recent trends to stakeholders.
This approach allows the use of the same queries for the CDC events in the cloud data warehouse and for the source data in the transactional database system.
Cons:
This approach creates a view over the table with CDC events. So instead of managing one relation, you end up managing another relations/views. You could mitigate this downside by managing the views with a tool, like dbt or Dataform.
This article showed how to stream CDC events from PostgreSQL, a transactional database system, to Google Cloud BigQuery, a cloud data warehouse.
By default, you end up with a BigQuery table that contains one row for each change applied to a row in PostgreSQL. We built a view on top of this raw table that creates a consistent snapshot of the CDC events, allowing data consumers to work with a clean and consistent snapshot of the data, without having to implement a deduplication of the CDC events themselves.
Get started with DataCater, for free
The real-time ETL platform for data and dev teams. Benefit from the power of event streaming without having to handle its complexity.